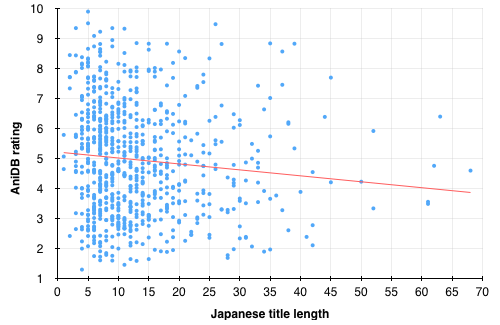
Lies, damned
lies, and statistics, part
III.
This graph is based on data for the 770 broadcast TV anime that AniDB
lists as both starting and ending between January 1, 2009, and December
31, 2014, inclusive. Lest you think I’m exaggerating with the title of
this post, the correlation coefficient for that linear regression line
is 0.0107. Existent, I guess.
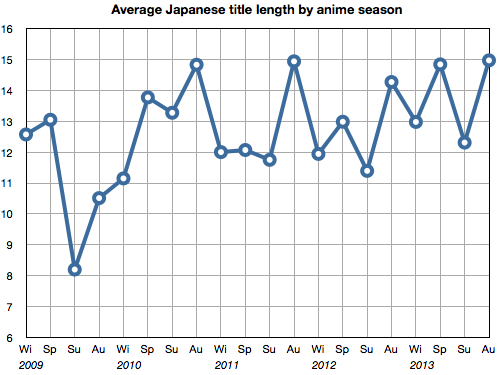
Lies, damned lies, and
statistics, part II.
This graph covers only anime with a regular TV airing, as defined by
AniDB, from which I pulled all of this data. Series are indexed by the
date of their premiere, naively sorted into season buckets in blocks of
three calendar months.
Oreimo aired in autumn 2010. Indeed, autumn has a pattern of having
longer titles in most years. What does that, or anything else about this
graph, tell us? You tell me.